This is a Remote Monitor that can function in Automate, that will trigger certain keywords that can be detected upon if the profile sizes go above a certain size. I have two monitors here, pick whichever you need depending on your requirements. The first will output all profiles and sizes, the second will only output profiles that are over the threshold. Both will still trigger an error if a profile is over size, this decision is more about the information you want returned in the monitor:
Monitor 1 – Pull back all profile sizes, regardless of size
"C:\Windows\System32\WindowsPowerShell\v1.0\powershell.exe" -NoProfile -command "& {$ErrorActionPreference = 'SilentlyContinue';$emptyOutput = \"\";$arrayresult=@();$thresholdInGB = \"50\";dir c:\users | foreach -begin {} -process{$size=(dir $_.FullName -recurse -force -ea silentlycontinue | Measure-Object 'length' -sum -Maximum).sum;If (($size/1GB) -gt $thresholdInGB){$var1 = \"ErrorCritical\"}else{$var1 = \"ProfileOK\"};$arrayresult += (\"{0:n2}\" -f ($size/1GB) +\" GB\",$_.fullname,$var1);};$final = ($arrayresult) -join \"~\";Write-Output $final;}"Monitor 2 – Pull back only profile where profile size is over the threshold
"C:\Windows\System32\WindowsPowerShell\v1.0\powershell.exe" -NoProfile -command "& {$ErrorActionPreference = 'SilentlyContinue';$emptyOutput = \"\";$arrayresult=@();$thresholdInGB = \"50\";dir c:\users | foreach -begin {} -process{$size=(dir $_.FullName -recurse -force -ea silentlycontinue | Measure-Object 'length' -sum -Maximum).sum;If (($size/1GB) -gt $thresholdInGB){$var1 = \"ErrorCritical\"}else{$var1 = \"ProfileOK\"};If ($var1 -eq \"ErrorCritical\"){$arrayresult += (\"{0:n2}\" -f ($size/1GB) +\" GB\",$_.fullname,$var1)}Else{};};$final = ($arrayresult) -join \"~\";if ($arrayresult){}Else{$Final = \"Profile Sizes OK\"};Write-Output $final;}"Step 1 – Decide on a threshold
Because of the nature of this monitor, the threshold has to be built within the Powershell. It is possible to extrapolate the threshold into a client based EDF, this is beyond the scope of this article though. If you want to discuss that come ping me in the LabTechGeek Slack (@Gavsto). Once you have decided on a threshold, modify the code above to include it (Variable is $thresholdinGB and is currently set at 50 in the example).
Pro Hint – you can copy the above code and paste it directly into a command prompt to test it – this is how I test all my Remote Monitors that have Powershell in because this is how Automate executes them
Step 2 – Configure and Test on a few agents
- Find an agent, Right click, Monitors, Create Monitor (Don’t select Create Monitor with Wizard).
- Call the monitor name something reasonable, I have my own standard for this – DISK – Profile size check for User Profile – Custom (MyMSP)
- I always tag any custom monitors with the word custom so I can easily filter my monitors and see which ones were manually created
- Go to the alerting tab, set whatever alert template you want to use (Default – Do Nothing) for now, I’ll touch on this later
- If you want to modify the Alert Message Subject On Success, make sure you set it to be identical to the failure subject too.
- Set a ticket category
- In the configuration tab, choose Monitor Type > External EXE Check. Paste your code in the Executable / Arguments box.
- Choose an interval for the top right – this value is in seconds. I think every 3 days is reasonable, so 259200
- Set the condition to Does Not Contain and in the result box put ErrorCritical
- Remember, on remote monitors we test for GOOD conditions which is why this is a Does Not Contain
- Choose Test on the bottom right hand corner, and ensure a result comes back that you would expect. The output looks a bit like this:
- 0.16 GB C:\users\Administrator ProfileOK~0.00 GB C:\users\administrator.DOMAIN ProfileOK~0.20 GB C:\users\bob.geldof ProfileOK~9.13 GB C:\users\ed.sheeran ProfileOK~7.51 GB
- Once happy, click “Add new” in the bottom right hand corner.
- A good Admin always tests extensively, test this against different clients and different machines with different OSes.
Step 3 – Deploy to all machines that need it
There are numerous ways to deploy this to all Windows Workstations, everyone has their own preferences. I prefer to apply to the Default Service Plan groups, and then limit the scope via a search. This allows me to see most remote monitors in one location. Before we do this, lets check the groups area to see how we will deploy.
- Go into groups, and open the Service Plan Group that contains your workstations. Mine is Service Plans > Windows Workstations > Managed 8×5
- Go to the Computers Tab
- Go to the Remote Monitors Tab
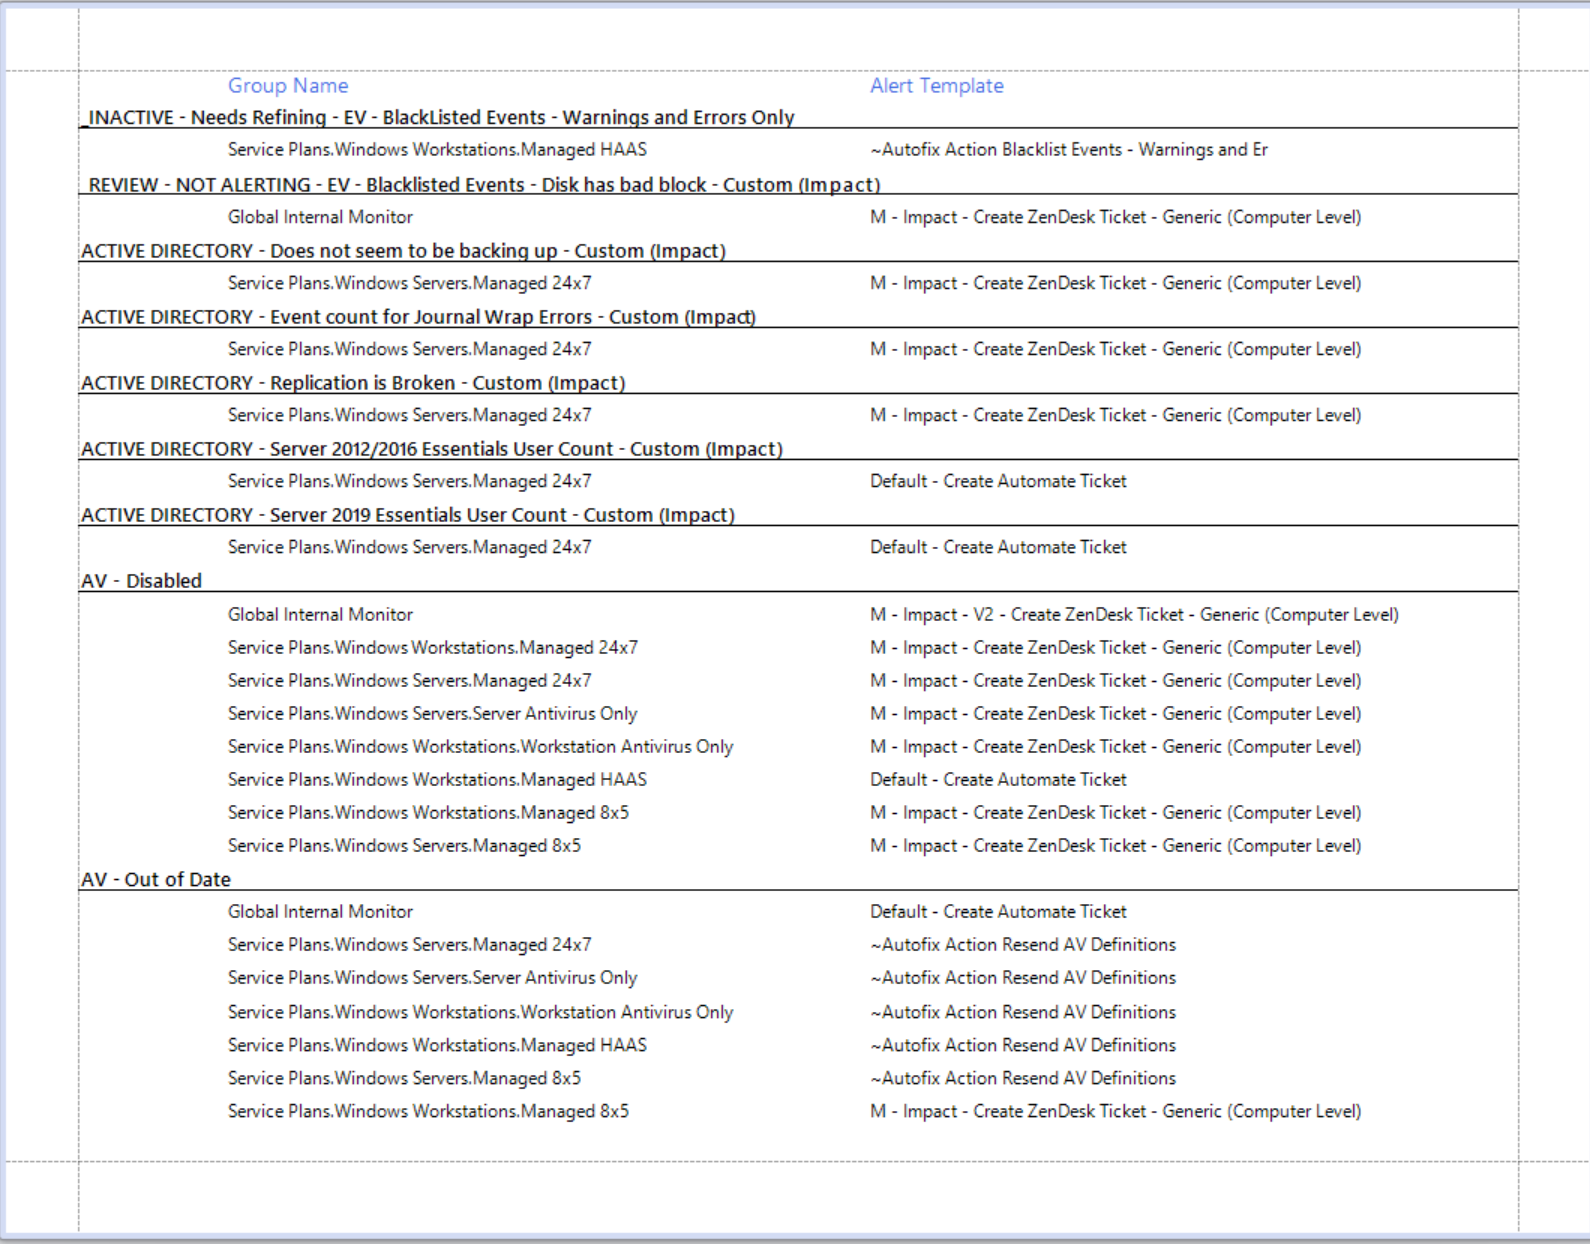
- Click on one of the Remote Monitors in the bottom pane. Notice how in the top configuration there is an option to Limit To. When this Dropdown is selected, the Remote Monitor you set this on will only apply to agents that meet the Criteria of the search you select.
- Re-open one of the agents you have tested the remote monitor on, Right click the “Gear” Icon in the top panel, and go to monitors
- Right click the monitor we created before, and choose Send to Groups
- Find the Service Plan group we identified before, tick the group and click send.
- Immediately go back to the Service Plan group and open it again, go back into Computers Tab and then Remote Monitors Tab
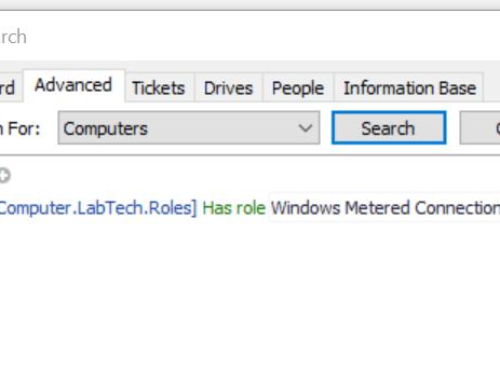
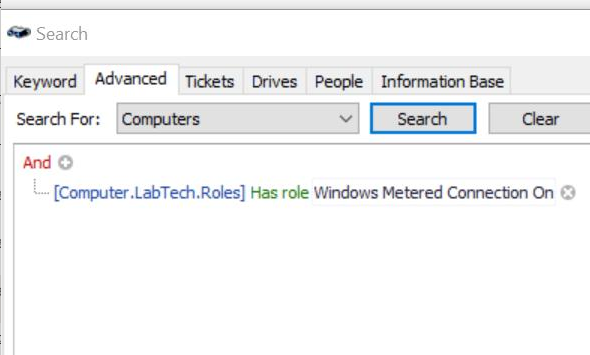
- Single click the monitor that we just sent here. In the Limit To dropdown, choose Computer Types\Computers – Windows Desktop and click Update (middle bottom right)
Step 4 – Monitoring the Deployment
It will take a good few minutes for the monitor to be installed on all the agents. The best way to monitor them is to do the following:
- In the Main UI Windows, Go to Automate and open Monitors
- Click on the “System Monitors” Tab (A System Monitor is a Remote Monitor)
- Ensure the results are not filtered (top right)
- In the monitor name column, type in %profile% and hit enter
- You should see a list of your test monitors at a minimum
- Keep hitting refresh until the monitors start to show up
- Please note – the monitor status information may not populate immediately, if all the Remote Monitors have appeared but none have Monitor Status Information, just leave it a few more minutes
When using Powershell monitors, especially ones that are deployed to many agents it’s important to manually scan down the monitor status information, to make sure that the majority or all of them are working as expected. Working with Powershell, it’s easy to come up with some Powershell that only works in certain situations etc. This view is great to see all monitors in one go (Hint, set the Page Size in the top right to something like 2000)
Step 5 – Gimme my tickets
Once you are happy that the majority of failures are legitimate failures:
- Open the group we set the remote monitor on
- Computers Tab, Remote Monitors Tab, Single select the remote monitor we have setup
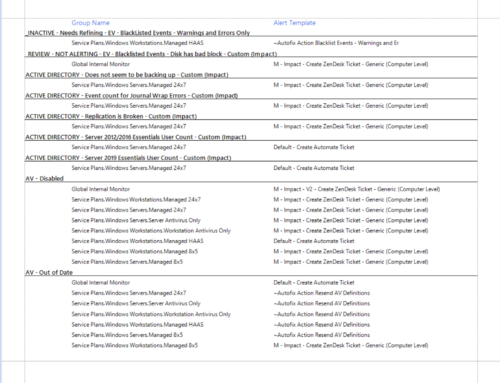
- Set the Alert Template (top right), Default – Create Automate Ticket.
- Click Update
This will reset the remote monitor and deploy it with the alert template in. This time when the failures trigger you should get tickets.
I hope this has been informative!
[/fusion_text][/fusion_builder_column][/fusion_builder_row][/fusion_builder_container]

[…] to create these monitors, more the code that can be used. I cover creating remote monitor creation here if you are not sure how to go about creating […]