The internal monitor referenced in this post can be downloaded here: LT – Offline Servers Custom – Hung Server I’ve been meaning to do a blog on RAWSQL monitors for a while – so here it is! The initial request is here https://www.labtechgeek.com/topic/4012-internal-monitor-for-over-x-amount-of-failed-logins-in-a-time-period The first request there is attached as a RAWSQL Internal monitor. Extract the .SQL from this and import it in the CC using Tools > Import > SQL File. The monitor name is LT – Offline Servers Custom – Hung Server. Pay particular attention to the column positions and the extras and read this before making RAWSQL Monitors http://www.labtechgeek.com/forum/viewtopic.php?t=293. This is what an internal monitor looks like:
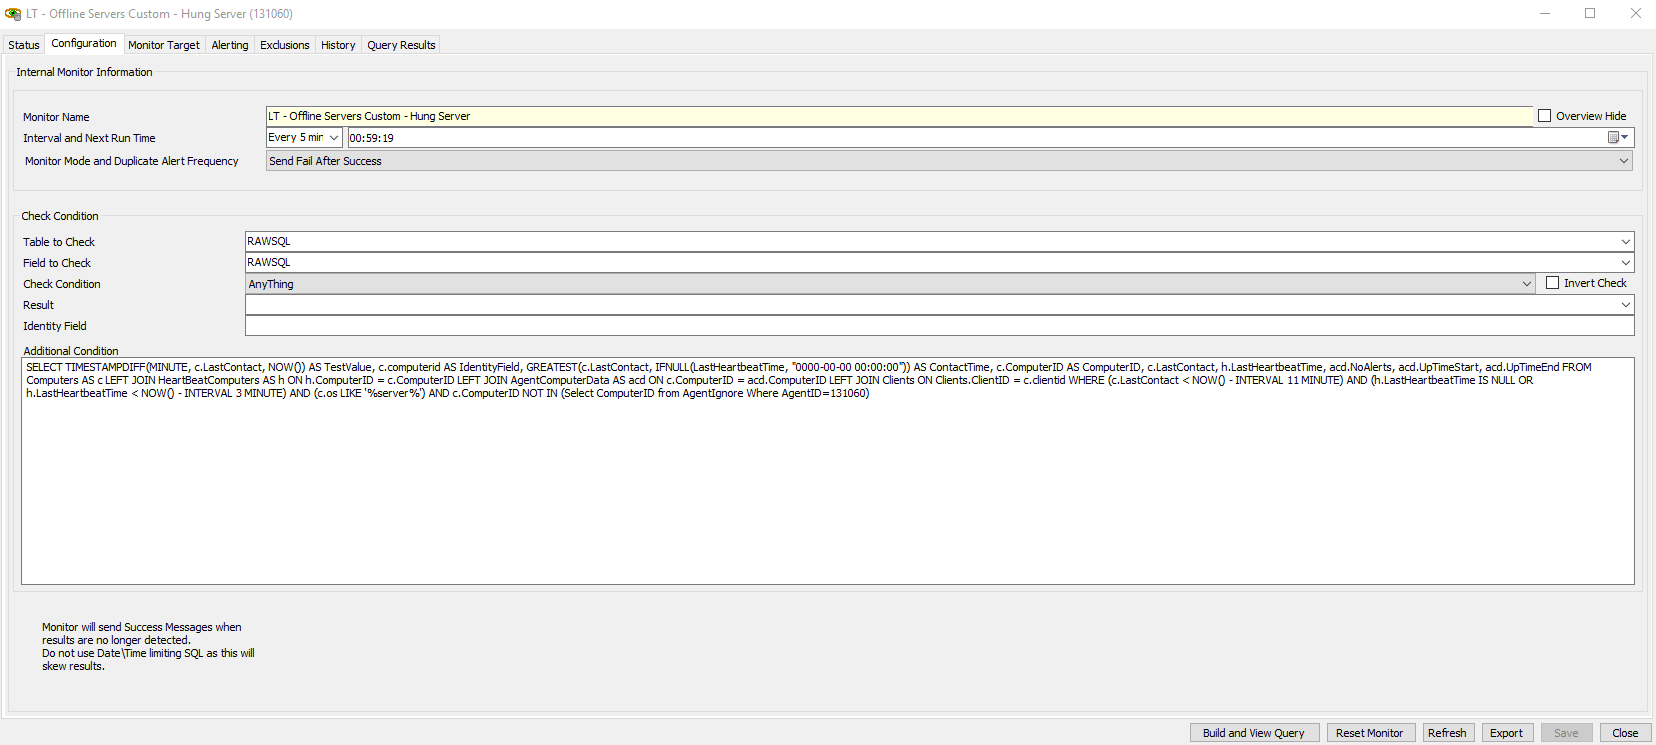
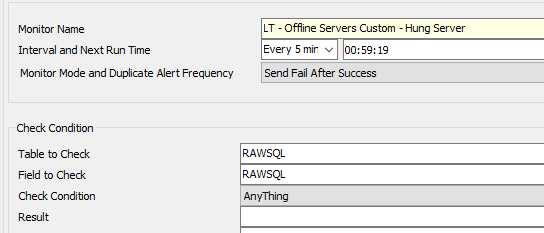
Pay attention to the Table To Check, the Field To Check – these are what tells an internal monitor it is a RAWSQL internal monitor. When the Internal Monitor has generated – it will have an ID (title window when you open the remote monitor, if it’s not visible in the CC go Tools > Show ID. Note down this ID and add :
AND c.ComputerID NOT IN (Select ComputerID from AgentIgnore Where AgentID=xxxxx)
To the end of the clause, replacing xxxxx with the monitor ID – this will ensure the exclusions work properly. If you want to use the Groups tab to limit where this internal monitor runs, you need to add the group in and add this clause to the end of the SQL:
AND c.ComputerID IN (Select ComputerID from TComp)
If you add the above clause WITHOUT targeting a group in the monitor you will break the query. If we look at what the SQL is doing I am hoping this will help anyone reading this to build RAWSQL Monitors:
SELECT Timestampdiff(minute, c.lastcontact, Now())
       AS
       TestValue,
       c.name
       AS IdentityField,
       Greatest(c.lastcontact, Ifnull(lastheartbeattime, "0000-00-00 00:00:00"))
       AS
       ContactTime,
       c.computerid
       AS ComputerID,
       c.lastcontact,
       h.lastheartbeattime,
       acd.noalerts,
       acd.uptimestart,
       acd.uptimeend
FROM   computers AS c
       left join heartbeatcomputers AS h
              ON h.computerid = c.computerid
       left join agentcomputerdata AS acd
              ON c.computerid = acd.computerid
       left join clients
              ON clients.clientid = c.clientid
WHERE  ( c.lastcontact < Now() - interval 11 minute )
       AND ( h.lastheartbeattime IS NULL
              OR h.lastheartbeattime < Now() - interval 3 minute )
       AND ( c.os LIKE '%server%' )
1) The positioning of this line is important, TestValue should always be the first column returned. This is the result of your test. It could be an integer value. It could be a string. It can be anything – put something here that is USEFUL to what you are doing. If you’ve ever tried a RAWSQL monitor before and all though it works the actual data it is bringing back has incorrect column names or the data is wrong, it’s likely because this is not the first column. The value being generated here is looking at the current date and time and getting the difference, in minutes between now and the last contact. This column needs to return as the name TestValue.
2) This column is the identityfield. This column always needs to be the second column returned or the monitor will revert to using the ComputerID instead. This is the column that helps to distinguish whether additional alerts should be triggered for a monitor based on the computerid. This can be anything as long as it is unique to your condition that the RAWSQL monitor is checking for. For example, in the above query it is the computername, but think of this column as a way to ensure you don’t get multiple alerts for the same failure whilst also giving you the ability to extract some reasonable information into the view. For example, I have another RAWSQL monitor that highlights when domain administrator accounts have been recently created. My identity field on THAT monitor is Client Name – UserAccountNameCreated. Pick an IdentityField that works well, because you can see it on the status tab on internal monitors. This column needs to return as IdentityField.
3) Is working out the last contact time based on the check in last contact value and the last heartbeat.
4) The ComputerID, which I always return as ComputerID identifies the agent – This is needed!
7,8,9) help the monitor determine whether it should be alerting or not based on the data in AgentComputerData table There are then some table clauses and joins between certain tables. You’ll need the join to clients and agentcomputerdata at a minimum. It finishes with some WHERE clauses which are relatively self explanatory. There are many ways to do a RAWSQL monitor – many are “right ways”. Bear the following in mind:
1) Build up the Query in SQLYOG or your equivalent SQL program first. Internal monitors don’t deal well with poor/badly formatted queries
2) Pay attention to column positioning in your query to ensure your results look reasonable when you go into the status tab on the monitor
3) Always include the AgentComputerData table and its three related columns, noalerts, uptimestart and uptimeend – the internal monitor needs them
4) The check condition in the GUI when using a RAWSQL monitor doesn’t really matter – I always choose “anything” from this dropdown.
5) Build and View Query, though it may look great in the preview will not represent what you get back in the status tab when the monitor actually runs. This is why column positioning in the query is important
6) If you have changed an internal monitor and for some reason it is not triggering alerts/tickets, it is likely you need to “Reset the monitor and run it again”. You can do this by right clicking the internal monitor in its monitor view and choosing “Run now and reset monitor”. This is a common mistake people make when they are running through a test phase with an internal monitor.
7) Always customise the monitor finally by adding the clause for the Tcomp table as demonstrated above if you want to target a group in “Monitor Target” and also adding the agentignore clause as highlighted at the beginning otherwise your Exclusions tab won’t work
8) When copying the SQL query from SQLYOG, always select, right click and copy with normalised whitespace. You don’t want fancy formatting in the box in the internal monitor as it almost always doesn’t work properly. I always save the “Fancy formatted” query I built in SQL to a .SQL file and store it somewhere (for me GitHub).
A lot of people get confused with Monitor Mode and Duplicate Alert Frequency and Interval and Run time. When you are doing your own monitors consider this: Interval and Next Run time = How often I want to check for this condition that I am defining in this monitor Monitor Mode and Duplicate Alert Frequency = How often do I want to be alerted about this particular monitor Send Fail After Success, is quite poorly named. In better worded terms, it is saying if a monitor fails, then passes again, then fails again – it will alert. Basically, it will send an alert EVERYTIME the monitor fails. When do you use this? The monitor at the start is a good one, we don’t want to set a time where this agent never alerts once it has enabled once – we want to be alerted everytime it fails.
This doesn’t mean that if you have the interval set to five minutes it will trigger an alert every five minutes, it means it will trigger an alert immediately again once the monitor has gone into a success state and then failed again. The duplicate alert frequency is handy for things like Eventlog checks so it will only trigger an alert once every x days for one event. You may want to check for an event every 5 minutes but only alert you once and then not again for x days. You would usually couple this with a where clause on the SQL to only bring back data that goes as far back as your duplicate alert frequency. That looks like this: and timegen > DATE_SUB(CURRENT_DATE(), INTERVAL 1 DAY) What that clause does is limit the checking of the eventlog table for events generated in the last day. This then means we can set the duplicate alert frequency to once per day and do a check every 5 minutes and only get one alert. Maybe you have a test that you actually do want to be reminded about or have a ticket constantly update every x days for a certain event. You can set that in the monitor mode and duplicate alert frequency and DON’T specify any time clauses. This should be used when a monitor can actually transition into a success state but you want to have alerts/tickets regenerated/updated if something still continues to fail. An event log monitor can’t transition into a success state because an eventlog either exists or it doesn’t, it’s not stateful in that regard. That’s why the date clause is needed. I hope this has helped demystify RAWSQL Monitors to a certain degree!

Hi,
Excellent article. My MySQL is quite rudimentary, so I have a question:
Say I have an existing custom monitor for one of my service plans. My service plan contains all of our client servers, both physical and virtual.
Suppose I want to modify this monitor to exclude all HyperV hosts? I know that I have the following group:
“Service Plans.Windows Servers.Server Roles.Windows Servers Core Services.Windows HyperV Host”
How do I find where something like this would be in the MySQL database, and what would the sample syntax be to tack on an
“AND c.ComputerID NOT IN (Select ComputerID from TComp)”
to the end of the monitor?
Thank you very much for your assistance. The under-the-hood bit involving the actual queries is the hard part for me; I’ve been a sysadmin for a long time, but never a database administrator, though I’m happy to learn.
Thanks for this tutorial it helps me a lot today to create my first RAWSQL monitor.
Thanks for explaining how these REALLY work!
Your download has some slight differences from your example. Mainly being that it lists Client Name and Location under a Locations Column, however there is a Typo with the query that results in Servers being listed multiple times for each location listed for a client.
Updated the following line:
LEFT JOIN Locations
ON Locations.ClientID = Clients.ClientID
to:
LEFT JOIN Locations
ON Locations.LocationID = c.LocationID
This fixes the problem.
Also added both lines (with my monitor ID in place of ‘xxxxx’):
AND c.ComputerID IN (Select ComputerID from TComp)
AND c.ComputerID NOT IN (Select ComputerID from AgentIgnore Where AgentID=xxxxx)
This allows for filtering both by group and by Exclusions tab incase the monitor is applied to a Service Plan Group and you would still like to exclude specific machines.